
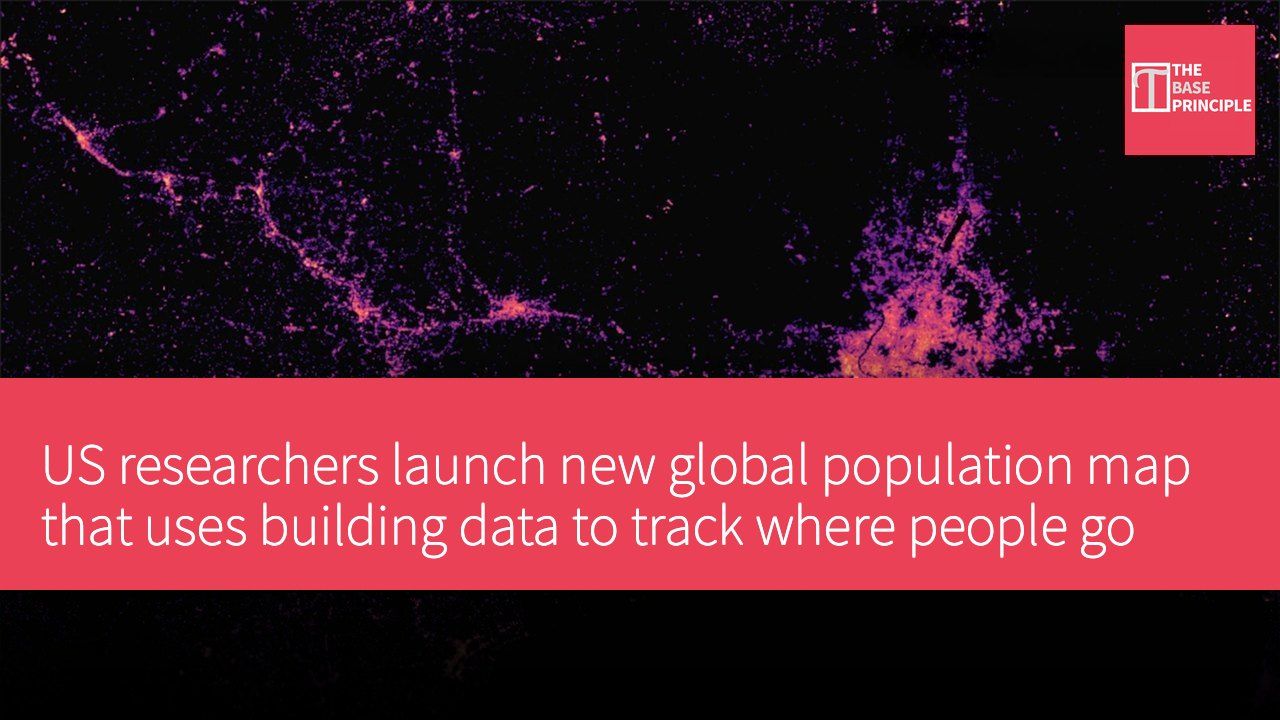
- LandScan Mosaic uses building data to track population dynamics, providing a high-resolution map of population distribution.
- The system accounts for where people live, work and travel to estimate their average location.
- LandScan Mosaic offers greater temporal and locational specificity than traditional datasets.
- The research team plans to release LandScan Mosaic Timeseries, which will reconstruct historical population distribution.
US researchers have released a new global population map that can track where people are likely to be during the day based on how buildings are used and occupied. Developed by the Department of Energy's (DOE) Oak Ridge National Laboratory (ORNL), the map, called LandScan Mosaic, reportedly combines building data, land-use information and machine learning to produce a high-resolution picture of the world's population. Conventional population maps typically rely on satellite imagery and divide the world into pixels, whereas this new system uses buildings to estimate where people are.
ORNL geospatial scientist Dr. Andrew Zimmer explained that buildings are used to identify population characteristics that are inherent to them. "For instance, people of certain age groups attend school," he noted. "So when we construct a population dataset, we can use building functions to inform, at a fine spatial resolution, the distribution of those young populations at specific locations, capturing daytime and nighttime dynamics."
Features of LandScan Mosaic
LandScan Mosaic is an extension of the existing LandScan Global dataset, a map system that is updated annually. It reportedly predicts the average location of people across a 24-hour period, factoring in where they live, work and travel. Standard global datasets have a resolution of roughly 0.6 miles (about 1 km); the main difference with Mosaic is its focus on buildings. When information about a structure is unavailable, researchers can use machine learning to estimate its attributes, including height, number of floors, function and type of use.
That information shows the occupancy of residential, commercial, industrial and other types of buildings.
LandScan Mosaic combines this information with land-use data and occupancy patterns to paint a picture of population distribution throughout the day. Rather than simply showing where people live, it also represents an "ambient population," or the average number of people at a location over a 24-hour period. This allows the dataset to account for daily movement between homes, workplaces, schools and other places. ORNL said the approach offers greater temporal and locational specificity than LandScan Global, and can quantify uncertainty by showing how confident researchers are in their population estimates, giving policymakers additional context.
Future development plans
ORNL R&D scientist Daniel Adams said LandScan Mosaic is the first globally available population dataset with these characteristics. "This is a very important project that demonstrates how AI and decision analysis can be brought together in a trusted way," he added in a press release. Combining advanced computing and machine learning with uncertainty analysis, he said, can make the data more useful in situations that demand rapid decisions, including disaster response and infrastructure planning.
The team's next version, LandScan Mosaic Timeseries (LSM-TS), will cover 50 years of population distribution, from 1975 to 2024. The system will use LandScan Mosaic as input and apply a "backcasting" approach to reconstruct historical population distribution. The 50-year timeframe, Zimmer explained, can help examine the growth of cities and settlements, especially before they were established. "The building-level framework and the daytime and nighttime data provide the opportunity to look at fine temporal resolution within a day and examine how those change over time," he said.
He concluded.
The team is also working on adding demographic characteristics to LandScan Mosaic, an effort that building-level data could help support. The research has been published in the journal Scientific Reports.
How the new technology changes population data analysis
The launch of LandScan Mosaic marks a significant advance in population data analysis, using the function of buildings to improve the accuracy and utility of the data. The approach not only reflects where people live but also captures how populations move during daily activities, with important implications for fields such as urban planning and disaster response. With LandScan Mosaic Timeseries in the pipeline, historical population changes will be easier to study, giving policymakers more comprehensive data to draw on.